The joys of networking.
I hate networking, small talk, trying…
No, I am not talking about that.
I am talking about one of the wonders of modern life, the LAN (local area network) in your house.
For some, this is synonymous with Wifi, of course, coming from a telecoms work life, we have an odd assortment of different devices and connection methodologies which we really do need to rationalise at some point…
Which was all fine until the Tesla stopped talking to our old network router completely about three weeks ago. On its own, we could have lasted quite a long time without the ability to go off-grid at a moments notice, but an annoying consequence of this was the component nearest to house was in the habit of beeping every five minutes.
Having some friends who are much more informed and experienced in these things, we bought a new router and you should be experiencing the joys of this equipment.
We certainly are! Faster wifi, consistently running in every room for a fraction of the power outlay. For a start, instead of needing three satellite pods to reach every part of our long house, we have one.
Wifi 7 seems to just work and at 46 Gbps (46,000,000,000 bits per second) is a bit nippier than wifi 6’s 9.6 Gbps. Of course, this is a little meaningless as our internet is limited to 915 Mbps download and 953 Mbps upload – internally we’re quick but it doesn’t make a great deal of difference when speaking to the outside world. Of course, Wifi 7 gives us more than a speed boost: this standard has far more resilience and increased bandwidth: which basically means we can support far more devices, if we need to, without issues!
We have a few legacy devices round the house which have their own dedicated area networks, allowing them to function and keep safe. Such networks are not as secure, so they cannot reach any of the computers et al that need such protection in terms of encryption and secure passwords.
This ability to create such segregated networks should allow our home control to provide great service for many years to come. The router itself will allow us to make that move at our leisure when we’re ready.
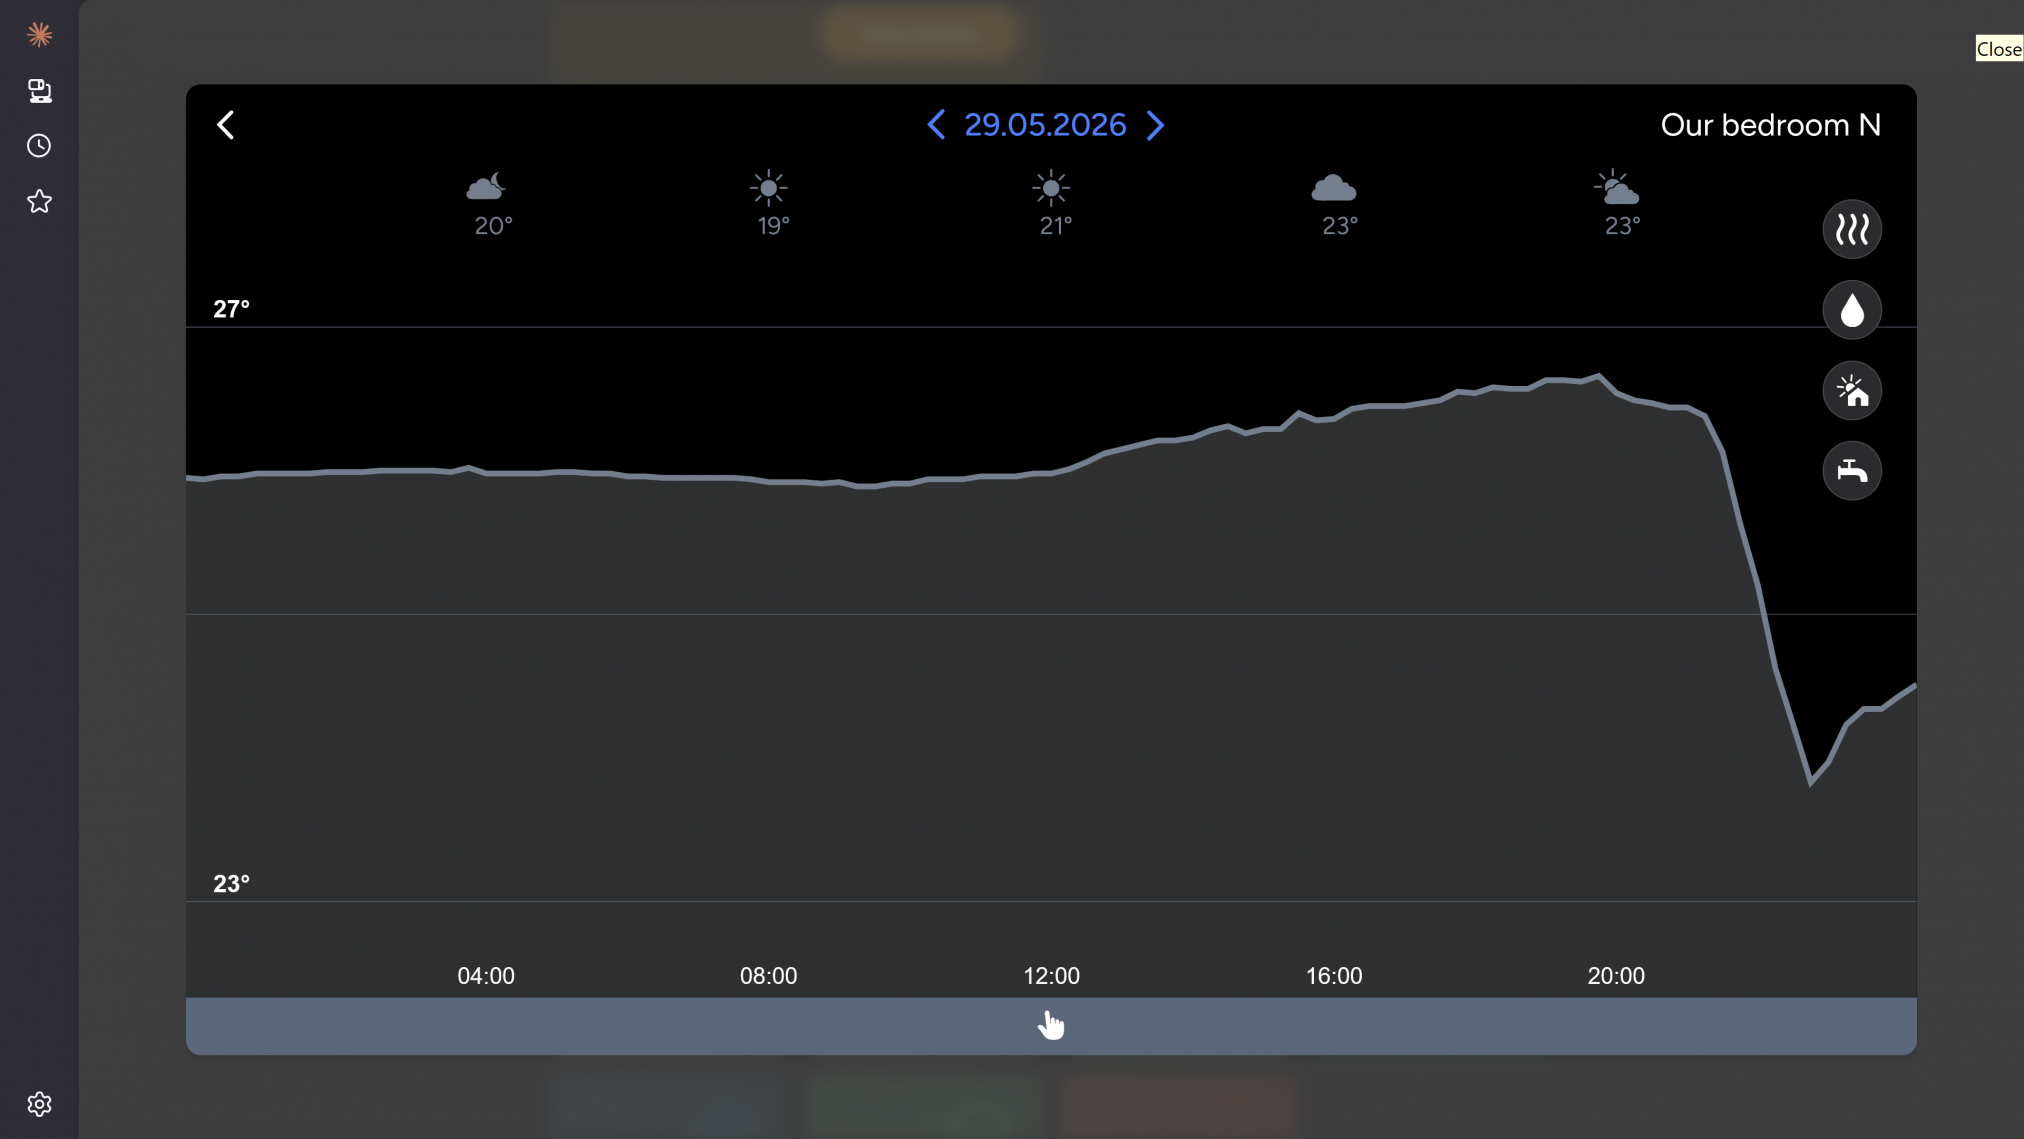
This is all about your automated home!
Not just that. Yes, much of our great energy performance is thanks to controllable devices, but on top of that is the services we provide for work and leisure. Being able to cast our phones to all our TVs, watching Apple TV et al.
Even our scales talk to our network, so we can monitor our weight, helping us make conscious decisions about what we’re eating and cooking. We should not forget the faithful 2016 internet tablet that lets us see the recipes I have published to help us reduce our cholesterol and increase our fibre in-take.
That’s without talking about our working. My husband enjoys working from home a few days a week and my new business is based here: even though much of it is run in the cloud, enjoying working from home is saving me money on office space.
But the combination of new and old is a battle many of us now face. Thankfully, I have never used WEP, but this has been unanimously dropped from all newly updated routers.
Having these separate subnets in our LAN means we can securely manage this, while retaining the services.
So how did it go?
Got the new one up and running in less than 10 minutes, and got 90% of the devices working without faff. A few things were picky and needed a special subnet, properly secured. We’re very happy with the new setup. And enjoying the benefits of good networking.
Posted: June 20th, 2026 under Work.
Tags: #CyberSecurity, #DigitalWellness, #FutureLiving, #HomeNetworking, #InternetOfThings, #RemoteWork, #SmartHome, #Sustainability, #TechTips, #WiFi7
Comments: none