It’s a lazy, sunny Saturday in May and I have opened our patio door wide to shelter from the sun. The shadow from our sun shade is covering the settee facing the courtyard perfectly, so it makes perfect sense. Honestly.
A splash of light cloud drifts across the pale blue sky. There are insects buzzing round the lilac wisteria, pink weigela, bluebells, white mexian orange blossom, light pink clematis montana, and white allysum (related to candy tufts). Some things have finished already this year: the lily of the valley shrub has done its business by March, and the honey suckles (a red and a white one) won’t come in to flower much later, around the same time as the passion flower.
I love the colours, the image above does not do them justice, and it is well worth the effort to maintain the garden. While we live on a busy road, the courtyard is protected by the house, providing a welcome respite from the busy world.
Our courtyard is a good size, when the traffic dies down the bushes and trees provide a shimmering rustle in a light breeze. The weigela is mature standing at a good 2m tall, and the japanese maple is now well over 1.75m, providing a colourful red fountain of leaves while a brilliant red rose grows next door to it, the dark green leaves popping against the firey red ones. The flowers are yet to bloom but the buds show promise of pillar box red globe flowers as big as my fist.
The walls provide a resting place for butterflies and larger flies as the barbecue slowly loses its heat from cooking a couple of home made burgers served in home made baps which we cooked for lunch.
Various birds are enjoying the shade provided by many of the trees in our neighbour’s garden and the ones owned by the council on the verge. Some squirrels are frolicking along the same branches too.
I love these times, sitting doing nothing, and thought I would share it with you and as a reminder to myself when the winter is at its bleakest, darkest, and dankest. Late spring will come again, along with summer.
For me, this is why I look to curb my carbon footprint, my waste of food, use an electric car, cycle or walk. To keep this reflection of eden.
Last week, we looked at the difference using our solar panels has made to our carbon footprint. Of course, that isn’t in isolation. At 27kWh, we have a large amount of battery capacity. But what got us here, why is that working so well for us?
What is the easiest?
Energy. I don’t use a hairdryer often. I dry my hair naturally. It means I don’t use much product at all. I put on a jumper if the room is 19°C, it’s not cold, if I am. So, I need more clothing. Thick socks are worth their weight in gold to guard against a chilly feeling.
The transport is next. If I possibly can, I walk or cycle. Blood sugar management makes a difference to what I can and can’t do, and that is really hard. But if everything else is working well, I can enjoy being outside and feel the sun against my skin.
We made the choice to move to using our combination microwave for most of our cooking. This is not a downgrade on taste but a huge upgrade in energy saving. I use it for all solo cooking and most of our two and three people meals. Even when using it as a fan oven, it is a much smaller cavity, so it heats up quickly without using more power.
Timing our cooking makes a big difference too. Last Friday, while the oven was warm after baking some rolls, I did some shortbread. The oven didn’t spend energy on cooling down then heating up, and the shortbread was a lovely, cheap, treat.
If you haven’t tried a combination oven roast, you haven’t lived. Tasty chicken cooked with peppers, tomatoes and roast potatoes and courgettes. All for less than £0.40 of electricity, if you aren’t generating it yourself (when of course the energy cost is zero).
Check out your kitchen and bathroom for halogen bulbs. At 50W a pop, having more than a couple in a room can ramp up that carbon footprint. Swapping to LED GU10 bulbs can make a significant saving – we had 28 in our kitchen (28*50W= 1.4 kW) and another 100W under the counter. Swapping them out in 2013 cost £200, but saved that in electricity costs in a month. We had 200W on average in 2 of the bathrooms and another 4 kW in costs around the rest of the house.
Swapping out the lighting took our summer monthly bills (at the time no solar power) down from £110 a month to £40. Of course, electricity was significantly cheaper in those days.
OK, so there are things I can do to reduce my carbon footprint and my draw on electricity. Why does that matter now?
Knowing our footprint and reducing our need for electricity means we have options available to us right now. Soon, I’ll be able to pop into my local Lidl and pick up a solar panel to plug into my 13amp socket and donate spare energy into the grid.
That’s without any need for some professional advice or delay in getting scaffolding to put it up on my roof. Or if I rented, no need to get permission from my landlord.
But that could mean wasted opportunities for people to use those panels in the most effective manner for their needs.
TechoSolara (please see https://techosolara.app) has been updated to provide users with the recommended “pitch” for their location in the world. TechoSolara gives the range of pitches applicable to the site in question, one value for the summer, one for the winter, and a third for the equinoxes (that’s autumn and spring to you and me).
Why are these different?
Because the Earth is tilted towards the star it is rotating around (Sol or the sun), during the summer the sun seems much higher in the sky. This makes a huge difference to the way photons emitted from the sun hit solar panels. The beauty about these “balcony” panels, is you get to easily change the angle at which the sun strikes the panels – effectively to track the sun.
Team that with the Cumulative Report in the “Planner 3 aspects” screen, and you can see when the sun rises in a given month, and when it sets.
If you are investing in some of these panels, it might be worth checking out TechoSolara on the Google play store.
One of the big benefits of having a heat pump that doesn’t provide cool air in the house, is the ability to stand in front of the fans while it rips the heat out of the air to heat our hot water. Yes, dear readers, this is what I have been doing in sunny Ipswich as Sol climbed to its zenith over the East Anglian countryside and towns. Standing and enjoying the cold air washing over me as the waste air was expelled from the heat pump.
We’re doing other passive things to keep our cool on this warm (and dry) May bank holiday. Most of them figure in the UK Health Security Agency’s pages on the short heat wave.
Not being lazy, being intentional.
When we lived on an estate, people thought we were lazy not drawing our curtains in the morning. But if you can leave the house in the early morning without opening the drapes and blinds, you get automatic shielding from the sun. I had a friend pop in after work one day and I drew the curtains as they asked whether we had air con. The room was about 18°C despite having a big south facing window because the blinds had shielded the room from the infrared heat.
Keep your windows closed as much as possible during the day. It may seem tempting, but often your house can be several degrees cooler than the outside and all you do opening the window is letting the hot air in.
Drink water and try to eat.
Water allows you to sweat and keep your inner core at a sensible temperature. Plain water is your friend. Salty snacks and sauces can help replace some of the salt you lose in perspiring too. You need around 30-35ml per kg you weigh.
I weigh 69kg, so 69*30ml = 2.07 litres of water a day or 73 fl. oz.
But that total is all the fluid you take in the day, including liquid in your food.
When the temperature gets above 28°C, humans start to struggle, though if we’re being careful and not doing too much, most of us are a way off heat exhaustion.
By the time you get to 35°C, and most people see their metabolism spike. Heart rates increase, stress chemicals are boosted, all in an effort to keep cool. The theory is that this leads to heat exhaustion, the body burning excess energy trying to keep cool. You will need food to power that energy burst.
No such thing as bad weather, just inappropriate clothing.
To quote Billy Connolly, what is true in the winter is doubly so in the summer. Clothing can help: ironically, long sleeved tops and trousers can help to wick away sweat and keep you cool. People who are based in hot regions often wear layers of light clothing for this very reason; especially when outside.
Wear light, reflective colours when you’re out in the sun. I love the old movies with armies wearing light colours when in the desert. Many think that is for camouflage: but really it’s because light sandy colours keep the soldiers much cooler. Remember those experiments in science at school? Well, that works out of the classroom too.
Hats and light scarves all help to shield the skin and body from infrared heat from the sun and reflective surfaces. Glasses help prevent eyes from drying out, as well as protecting against glare and UV radiation.
Choose your time of day.
Going outside is best avoided in the UK between 11am and 3pm during May. I would add that if you live by a busy road route, heat from cars can be high between 4pm and 6pm.
Going for a walk before 11am and after 6pm can allow you a kinder time of it to your body.
The same with your car: parking the car in your garage allows the car to start the journey cool, saving energy (petrol, diesel or electricity) on powering up fans and air conditioners.
If you can’t do that, open windows at opposite ends of the car when you first set off can help the car lose heat sooner: I do passenger door front and the window behind the drivers seat. I’ve heard people recommend “wafting the doors” on opposite sides of the car too, but that can be tricky in a car park! Remember to put the windows back up to aid your fuel efficiency when your speed increases. Venting your sunroof can be really useful too for the first five minutes of the journey.
Plans for the rest of the weekend?
A quiet one for us, though I will be keeping an eye out for when the heat pump’s fan is turning and popping out with a chair, a book, and some headphones to enjoy the cool waste air from the heat pump.
Have a lovely break. And remember to wear sunscreen.
It’s hard to believe the UK has broken its solar generation record twice this April, after such a dull and grey winter. The day before that last record was broken, the UK achieved its lowest ever value for how much carbon dioxide was used to produce its electricity. These two things are connected!
When you have solar panels, you appreciate the tie between the temperature and the amount of sun your bit of the world really gets. The cooler weather and the sun’s angle on the panels add up to great solar generation. If the clouds are at bay…
This year, the start was grey but by the 7th April, we had one of our best days ever, as did the solar generation farms in the UK, producing at total of 14,414 megawatts (MW) or 14.414 GW (gigawatts).
When it’s not what you have, but what you do with it.
Our solar generation means we had enough to cook, clean, heat water, run extractor fans, charge the car a little, heat a couple of radiators first thing in the morning.
It wasn’t the only day we were in this situation. Towards the end of the month, and we had had several “off-grid” days. In prep for our annual barbecue, I was able to make four batches of rolls from our generated power and the stowed excess from our generation.
The second tesla battery was in place by this time last year, but it still feels a bit new and revolutionary. We are not gaining much from exporting excess electricity just now, though as the days lengthen this summer, that will change.
I know many people are buying electricity at 5p a unit and selling it back at 15p a unit. I am not sure how I’d feel about that as our goal has been to reduce our carbon footprint since having the batteries. Ovo are about to do a “2 hours of free off peak electricity a week” between the 18th May and the 2nd August 2026. I suspect this will be during midday. We’ll use it to run the dishwasher and cycle the washing machine!
Given this forecast, we’ll be making sure we’re making us of our 27kWh stored in our battery from 5pm to 10pm. Our current draw is 1.5kWh as I finish off the final batch of rolls. This means we should be fine until the sun rises tomorrow.
Our Tesla app allows us to see exactly what is being used anywhere in the house. We can see what is coming off the roof into the house and/or battery. Even at 5:40pm, we are generating nearly a kilowatt of electricity. Switching to the microwave, we can cook our evening meal during peak time. This avoids pulling off the grid during the first few days of May.
Gearing ourselves to manage within this budget has not meant changing our lives. We pay £150 a month to be attached to the grid for backup power. If we have a very good spring to autumn, that can drop to £40 a month in January and February.
For us, it works really well. We save up the money to insure the house and the cars during this time. Pairing that with the water meter, and we can see that our monthly bills are a predictable £170 a month.
I appreciate that is really high compared to many. Remember when the energy prices rose in 2021 and people were finding their energy alone jumped to £400 a month?
What about your carbon footprint?
We’ve used 3.217 MWh of electricity from the grid this year, so far. The carbon rate is currently around 129 gCO2/kWh => 421 kg CO2. The estimate for the year is approx 1,266kg CO2 or 1.266 tonnes of CO2. Heating is the main source of this carbon. We need to consider that there are two people living in the house, so that’s 633kg CO2 per person.
The remainder of the year should see us using significantly less. Increased solar generation and the heat pump will see to that. Still, it would be amazing to bring that in to under 1 tonne of CO2 per annum.
As I look at the Enphase website while writing this blog, I realised we hit a major milestone. Since we installed our photovoltaic panels in August 2014, we have generated 41 MWh of clean electricity. That’s allowed us to stop 11 tonnes being released into the atmosphere, roughly 1 tonne per annum.
It’s a reminder that while the daily ‘budgeting’ of energy is a modern habit, we watch TV, heat our food, have cups of tea, but the cumulative effect of twelve years of sun-catching is where the real change happens.
How does that compare?
The average UK home produces 6 tonnes of CO2 per annum, the majority of that being for heating. That’s the estimate for an EPC E rated property in the UK.
This is a small percentage of a person’s total carbon footprint. Tools existing that provide an estimate of your footprint, and this year, my total is likely to be around 6 tonnes – that’s all my food, travel, heating, cooking, and purchases.
A typical footprint in the UK is around 10 tonnes per person: transport makes up the majority of this. Since starting my own business, I have chosen to work from home, allowing me to dramatically cut my footprint in terms of transport. I now do around 5,000 miles in my car (around 3,000 of that in my EV), 2,000 on my motorcycle. That saving in transport means nothing if I move it to heating the house excessively or making inefficient cups of tea!
Complicated?
And potentially hiding a great deal of the detail. I don’t buy clothing often, I still wear clothes that I bought as a teenager.
Meat is part of my diet, but rarely have more than 100g (4oz) of meat in a sitting and no more than that during a normal day (our barbecue is the exception for that). I try really hard to ensure my food is sourced locally. It is the hardest thing of all to control. The closest I come is ensuring we eat food that is in season in the UK.
Food sourcing is the one I’d love help with. If you’ve cracked it — or found something that works even partially — I’d really like to hear about it in the comments.
Throughout time, humans have celebrated life’s big events. Sometimes lavishly, sometimes simply.
Every year, we have a barbecue while a classic car run goes past our back garden. We are not the only ones, and on a sunny (or at least dry) day, the crowds lining the streets are almost as entertaining as the cars, push bikes, electric vehicles of all ages, tractors, fire engines and police cars, motorbikes, and lorries going past.
As I took a couple of days to prep for the event this year, it’s one of the few where I can honestly say “no hydrocarbons were burnt making these rolls”. In fact, I did slightly better than that as mostly the sun was shining while I baked, so we got to enjoy 100% of that power rather than dropping 7% in the round trip from the battery!
Tonight, we are using the last of the excess stored in our battery from the past few days. It rarely means we are 100% off grid, our battery system is a little slow at switching to the store when needs change but it doesn’t do a bad job.
Of course, now we are entering summer, our generating potential is being affected by other factors. The trees being in full leaf makes quite an impact: no it doesn’t mean we wish those trees were not there. A healthy tree does far more for reducing carbon dioxide than our photovoltaics do! A pair of mature maples (like the ones we’re talking about) take ~50kg of CO2 a year out of the air. Our 4kW system saves around 700kg being produced a year for our electricity.
Er, hold on there, shouldn’t we have more panels less trees?
No, we shouldn’t. The panels mean we produce less, but trees actually reduce what is in the atmosphere. The estimate is that plants and oceans absorb roughly 30% of the CO2 people currently produce.
In fact, if we can reduce our carbon production to a low enough level, there is a chance plants can help us recover much more quickly – though we are still talking hundreds of thousands of years to get back to pre-industrial levels.
Something that took 150 years to achieve would take hundreds of thousands of years to recover from, if we could reduce our carbon footprints enough to reach zero.
We can all make a diference here. Drive less, reduce energy usage, reduce waste, switch to a higher percentage of plant based foods are all things all of us can do.
Oil prices should be higher as it does change how people behave.
While researching this blog, one of my biggest findings has been that homes in rural areas are much more likely to make the switch to heat pumps than homes in towns. 75% of heat pump installs were in rural areas compared to 25% in towns. The volatility of oil prices are thought be a leading factor in those decisions.
I know you say heat pumps are super efficient but you can’t win!
The laws of thermodynamics are irrefutable; and no, heat pumps do not break these fundamental laws. The first law of thermodynamics says you cannot get more heat out of a system than you put in (you can’t win). In heat pump terms, this isn’t efficiency but the coefficient of performance and that is a better way to think of the figures – an efficient heat pump achieves a coefficient of performance of 3.5 or greater over the entire year.
How can a heat pump be more than 100% efficient? This is what I understand. Heat pumps look amazing because for each unit of energy used by them, between three and ten to twelve units of heat (all measured in kWh) are achieved round the system.
Heat pump systems do lose heat: radiators and heated floors work by that very principle. By the laws of thermodyanamics: you can’t win and you can’t break even. In terms of electricity put in and heat delivered round the system, it does look as if that is happening – until we realise that our “loss” is the unit of electricity we are using to pull the heat out of the atmosphere and send it round our heating circuits.
We are not beating the odds because we are not creating heat, merely moving it from the air into our heating water and hot water.
If we can use home or micro-generation to supply the energy for the heat pump, and our homes insulation so we enjoy as much of that heat as possible, we are looking at a brilliant way of keeping our homes warm and our water hot.
Having had one for a year in the Suffolk Surburbia, I wouldn’t go back.
Before Covid 19 and lockdown, we spent an eye-watering amount on ready meals and eating out. It wasn’t just speed to table but energy levels. It was just easier – less washing up, less time to table, less effort.
Like many, my home cooking repetoire was pretty limited.
I don’t blame anyone for doing that. I really don’t. But even in that whirlwind of work, raising my kid, and living well, we had three meals we cooked from scratch during the week and everything was home cooked over the weekend unless we ate out.
I now cook wide range of foods, as nutritiously as possible in as little time as possible.
But I still make use of convience. I make my own shortcrust pastry, but by puff pastry. I feel really bad about that, because a “rough puff” isn’t that hard, it’s just time consuming! It’s just being organised enough to make the plan of a morning and stick to it.
I’ve also stopped making my own pasta. I buy dried. The bread is easy because, for a basic loaf, it just goes into the machine. Rolls are a little more involved (I am waiting for a batch to do now), but while it makes washing up, the task is really easy: bung the ingredients into the machine and take out bread.
Pasta is, mix ingredients, chill for 20 minutes, rollout into the shape you want, hang up and wait 30 minutes, then cook.
Pasta shapes are much quicker, but a lot of faff. The results are not as guaranteed either – I know if I practiced this more, I would get better at it, but I don’t enjoy it enough.
Which makes me wonder about the yogurt I make and the bread I bake. The yogurt, on paper, is a great deal of effort: heat milk, allow milk to cool, the heat milk for hours.
It’s easier with the machine, but it’s a big commitment. I love the results mind.
I am making three or four batches of rolls over the next few days for our big barbecue of the year. Because I predominantly now make the brown rolls, this is 3¼ hours of waiting then the last three stages are all done my hand. But they really taste good.
On Sunday, I’ll make the bread totally from scratch for eating on the day. But the rest will be finished off – if I part bake them, they keep really well and taste amazing.
A little salad, hence the yogurt for coleslaw (my favourite salad thing), some freshly made burgers and Bob is your uncle, so to speak.
We have one “emergency ready meal” a week, typically a curry or complicated tray bake thing. Something we don’t cook ourselves very often. We have family favourites we come back to time and again…
It doesn’t look too bad a way to approach life, does it?
Whatever your plans are for the week, bon appetit.
I have spent the past four years of my career helping teams understand their cyber risk.
I would say, first and foremost, many of the established ways of doing business fundamentally introduce vulnerabilities into code.
I love open source, but there are libraries I do not touch because I only “need” a couple of functions and the remainder of the library is just not well written – but many of the cyber scanners will report you have risks that are not appropriate for you. Which then needs to be analysed.
It’s noise. Many firms are losing personel too, which is going to amplify the impacts we’re seeing.
I’m starting a few projects to see what the market is interested in, and I have to say, I am not keen on using an AI that suggests doing things using insecure libraries. Because I am looking at doing stand-alone tool on Android, why would I use anything that isn’t part of the core languages I am using?
I am starting as a sole trader, as soon as I register my company. Why would I make my life harder by using libraries that are not really well written?
How can I tell?
This is a really good question, and many people will point to open licensed versions of the big scanners, things like SCA or source composition analysis (for analysing those open source vulnerabilities) or SAST (static application security testing) tools which analyse your own code.
SCA in big companies is really important, but if you are doing something novel, your design should include some basic checks. My main server is using Tomcat, so I can physically go and look up this component here: https://www.cvedetails.com/version/2036048/Apache-Tomcat-10.1.48.html. When I am writing this, this version has no known issues found against it.
I make the choice to use a library, I can go and look that up. Including a linux tool, most of those are in here. Each vulnerability is looked at in terms of how the exploit is leveraged, so if you really cannot upgrade the library, toolset, or function, you can quickly decide how the mitigation is going to be made.
Such practices allow code to be maintained. Some of my code is over 30 years old now, and still works. I keep my code lean.
Key questions.
If you are using a library from somewhere else, what appetite do the manufacturers have to look after the code? How often do they review what is in that library or toolset? How are releases made?
Should you own some of the functions after a while? Open source is great for getting you going, but actually, if you are using a tiny subset of the library in question, should you edit out what you need?
Are you updating your languages often? Can you automate that update and regression testing? Do you have testing and development areas so you can do that with a “if it all passes, go straight to live” mentality?
If not, is it being flagged to the appropriate people to say things are not working? Are those tests failing supported by error handling with allows those people to go straight into the functions in question, to make debugging easy?
Do you have designs that allow deep debugging without much head scratching? UML is ideal for this: I love an object design that includes the lirbaries in question.
Isn’t this all a lot of effort?
Yes, but if you are doing things properly, shouldn’t it be effort?
What about if you haven’t done enough?
I formed my company on the 1st March 2026. I produced a company website, running on my existing infrastructure. But on the 18th March, my home website was attacked by a sustained distributed denial of service attack (aka DDOS).
Because my site is engineered for resilience, it only affected two of the services I offer. Logging helped me identify what was going on. Because this is not my area of expertise, I did reach out to Claude to help me configure the services beyond what was already in place.
Within 3 hours I had a solution and, more importantly, was able to re-establish provision of service. I think that is slow, but would have taken me longer without that access to approaches and techniques.
But it highlit that actually, such tools, like people, do not work well without breaks. The models found difficultly reshaping their reasoning based on new facts after ninety minutes or so.
The good thing was the tools I approached looked at the underlying architecture, but this probably missed some avenues accessible from the tools being impacted.
Why were you attached?
Always an interesting question, but I think this was a webcrawler looking for holes across the internet. I had 2 million hits per hour. That’s not a targetted hit, that’s a “I’ve found a weakness, I’m having some fun”.
The security fixes I have put in were only possible because I was fully patched. Otherwise, I would have had to fully patch first, then apply the fixes after that.
Many systems do not come “pre-hardened”. Documentation can be difficult to find, without seeking it out. Maybe tools like Claude.ai and Gemini would help people to do that.
Of course, some people are using such tools to find exploits. Tools like chat bots have allowed queries to be much more effective without specialist knowledge!
But the opportunity is there to enable you make your environments safer and more resilient to attack.
This is a quick recount of forming my own company in the UK from having an idea on the 14th February 2026 and releasing its first product on the 9th April 2026.
That’s 7 weeks and 6 days…
Actually, I was on holiday, 5,000 miles from my home (as the crow flies) without a computer when I had the idea for making the TechoSolara app (it wasn’t called that yet) and realised it could mean I didn’t need to seek funding for my time to do something else (a completely different type of application) in the long term.
In the remaining 12 days of my holiday, with a Kindle Scribe and an e-sim in my smart phone, I formed the business plan, formed the market analysis, and worked out the plan to market.
We landed and I had scheduled my time to start properly on the 2nd March. I spent those 4 days getting the technology working – upgrading my webservices, ensuring I had a content management system, an effective work environment, back-up mechanisms, and updated my servers. I knew once I was “up and running” as a company, there would be little time to do anything else.
I also knew, because it was going to take physical time, that I would not be trading before the start of the tax year.
First task: incorporate a company.
This has loads of implications, but as my business plan was seeking to reach 50 countries in the first 6 months, and I was going to be filing a patent, this was the right choice.
Took 2 hours. Trading date was the 6th April 2026, so that made some things interesting.
Second task: file the patent.
I’m patent pending. As soon as it was filed, I started coding.
Third task: get a developer account on Google Play Store.
Tricky – needs the company to be registered with a DUNS number which takes about a week.
Fourth task: write the actual code.
Actually, I’d already started this, as a background task. I’d also approach some friends for some help. I needed beta testers. It’s the hardest thing in the world to test things. I had a date in mind of the 23rd March and I pretty much made that. Sorting out how that delivery would work relied on…
Fifth task: form a company website.
It’s now mid-March and testing is going OK. So I buy a DNS and launch the website.
Pretty much this time, I have a denial of service attack on my home server! Only knocks out a couple of services and ironically not the “work one”. Still, I lose a morning to fighting it off.
Sixth task: initial marketing and help files.
The beta testers need to be able to use the app as real users do. This means it needs a help file.
Seventh task: have a bank account.
My business needs a bank account so HMRC and Google can talk to each other. I don’t make a good choice but signing up with Starling in the second instance means my account gets cleared and I can now publish when ready.
Eighth task: form automated testing.
While judging the look and feel of a tool is really difficult without a diverse set of users actually using the tool, you can make sure it can add up properly and function quickly and well. Due to the architecture I was using, I was keen to do this “the right way”, so I made use of Claude.AI to identify and write some tests for me – it was something I had never done before – I had automated testing but that was before junit testing existed: interesting story, but the rule is to find the chase and cut to it…
Nineth task: beta testing.
I launched beta testing and got the app on to the Play Store as a managed publishing task.
Friends, Romans, and country men, thank you for your dedication to the task you offered to do. The sales I have achieved are thanks to your dedication.
When I got the all clear from then, on Good Friday, I published that last, cleared and tested version.
Tenth task: the waiting game.
Before the Easter is not the time to do – normally, the whole process takes less than an hour. 4 days later, I got the go ahead and the tool was launch.
Now, you go round the develop, test, release loop ad infinitum to gain more users and help more people get solar panels.
But you now have a business that can be expanded, hopefully, if the ideas are good and the marketing is getting them to before they buy something different.
It’s not necessarily difficult, but setting up a business is time consuming.
So what are you actually selling?
Read all about it at https://techosolara.app . I would love to hear your thoughts on how this can help people across the world take the step or extend their solar generating potential.
It wasn’t a terrifically warm or sunny Easter, but the week after it was. Time to erect the sail shade I had bought last year.
You waited eight months before putting it up?
When you put it like that, it sounds like a missed opportunity. However, there were reasons, not limited to the fact I couldn’t see how one person could do this on their own. All the shows I’d seen where a sail shade was featured had a team of people doing the task. Was it even possible that two people could install one safely?
Sails need anchor points and until the French doors were put it, we didn’t have a good one on the house.
Winter is not the time to be erecting a sail – no matter how waterproof it is, leaves, snow, heavy rainfall, and high wind do not make for good weather to be raising a sail.
We would not have been able to enjoy the sail, all the while, it is exposed to harsh conditions which would wear it out.
I have been patient and two weekends ago, we started to plan to location and install.
You make it sound like a military installation!
A little bit. Sails need to be secure: being waterproof is not enough to guarantee that once it is up, it won’t collect water, putting enormous strain on the fixings and to what-ever the fixings are attached.
Counter-intuitively, tautness is your friend and that allows water to run off and wind to skip over the fabric. That means the fixings need to be firm and attached to something strong.
Here comes our balcony, which needs to with-stand 1.5kN/m2, so a very heavy individual can fall on to it and not break their neck falling to the ground because the rail has failed. The barrier is assured to do that. The sail can exert around 550N in a 60km/h wind. That’s one fixing point.
Of course, the nice shiny barrier is not something we want rubbed by a rope or metal fixing. An Augo Heavy Duty soft loop is our friend here, built to secure goods on ship and on HGVs, they form a strong fixing point for the carabiners that came with the sail.
Next fixing point is one of our fence’s steel reinforced concrete posts. The Augo straps came in handy here, being just long enough to be fixed round the post with a carabiner and a turnbuckle to secure the sail, and give us the chance to tighten everything up once in situ.
Finally, our courtyard has a double layered 1.8m wall on one side, allowing an anchor point to be fixed to the top of it.
The sail came with turnbuckles, rope, and carabiners. With the Augo straps, we were all set to go. Last night, we did the deed.
Only to find that while we did raise the sail, it was a little baggy. Remember how I said tautness was our friend.
Yes, but I really don’t see why some sag in the middle is such a bad thing!
A 5m equilateral triangle (which is what our sail is) has an area of 10.83m2. (This is from Pythagorus: a 2m equilateral triangle has a √3m height. A 5cm triangle is two and a half times as big, so it’s height is 5√3/2 – a triangle’s area is a half base time height, so that 5/2 * 5√3/2 = 25*√3/4).
Any chance it has to “billow” makes that a huge area, up to 4,970N for a windspeed of 25m/s, it’s why sails were so effective in powering ships.
The same chance to billow, provides a reservoir for rainwater. A cm of water on the sail is equivalent to 500kg!
The sail being as taut as possible harms no-one.
But with the nylon rope that came with the kit, we just couldn’t get it the materials to work for us. Having seen steel rope used for other sails, I bought a 4m, 4mm 7×19 grade section of rope from our local chandlers. A pair of thimbles and four wire grips, and I set about attaching the steel rope to two turnbuckles.
As we already had the rope up from yesterday’s efforts, I put in the cable.
As I started tightening it, I realised I hadn’t removed the old rope. At which point, I had a problem to solve as I hadn’t done something which would have made the task a hundred times easier. Simply putting the turnbuckle hook outside of the rope would have allowed me to easily remove it. Instead I wasted twenty minutes sorting that out, but it was a much easier job to do on my own that initially putting up the sail.
Because the steel rope is rigid, the turnbuckles give a set tension. It pays, from that point of view, to tighten the rope either first thing in the morning or just before sunset. That allows slack to be built in for when the sun it at its apex. I am now waiting for that moment to come.
Of course, to get it really drum tight, a lever can help me achieve that. From my engineering days, I am going to use a chisel blank I made in 1995 to help me get those ropes as stiff as a tuned guitar.
We’re finishing that tightening this evening, so we can enjoy the sun and shade for the rest of the summer.
You called this article “Dark powers”: not sure this is what I was expecting…
As a child, I was taught you can shade something to keep it cool or try to cool it after it gets hot.
Shading something is always easier.
Having put everything in place and down on paper, I think it could be done by one person next time.
Words to the wise: the majority of this paper is our usual exploration on how you can see the impact your efforts make in your home.
I do include the actual mathematics at the bottom to explain where some of this has come from – you do not need to read this unless you want to!
The past few weeks we’ve been examining sustainable heating. I’d like to take that to the point where we start to look at how we can put a value on the steps we’re taking by using what is at there at our finger-tips.
U-values tell us how effectively our infrastructure (windows and walls and insulation) helps us retain the heat our systems put into our rooms. Each component has its own u-value and we can add them together to get a total.
But this is not a simple sum on paper, because much of the material of our houses are built with are hidden from us: we tend to buy completely built houses without the choice of materials being given to us. EPC’s give us an estimate, but unless you have been lucky enough to witness the builds, that is all it is.
Working out our u-value.
Let’s see if we can’t “reverse engineer” our total/effective u-value, by observing what is happening in real life. We are going to do this for our louge by looking at the change hanging curtains up will make.
This is the day before the curtains went up:
We can see the drop in temperature over night, from 22.2°C to 18.5°C by noon! Tying that to our heat camera shows that even with it’s impressive u-value our patio door is a source of heat loss – to the turn of 7.5 m2 * 1.2 W/m2K ≈ 9 W/K.
Words to the wise, a Kelvin is exactly the same size as a Celcuis – but the scale is off-set. This allows absolute 0 K to be -273.15°C, but 1K = 1°C. So, the 2.6°C we lose is worth about 24W of power.
Now, our tado thermostats and radiator valves log all the temperature changes over the past few years. But since we have had our new window, we have not had the curtains – so while I can look at the data from the last week of November and see that 2-4°C is lost almost all days. We can also see our solar gain in action or the heat pump or the log burner.
The question is, will our curtains help to cut that loss? I will use a couple of days to verify the saving.
What was the results then? How much difference does it make to put your curtains up?
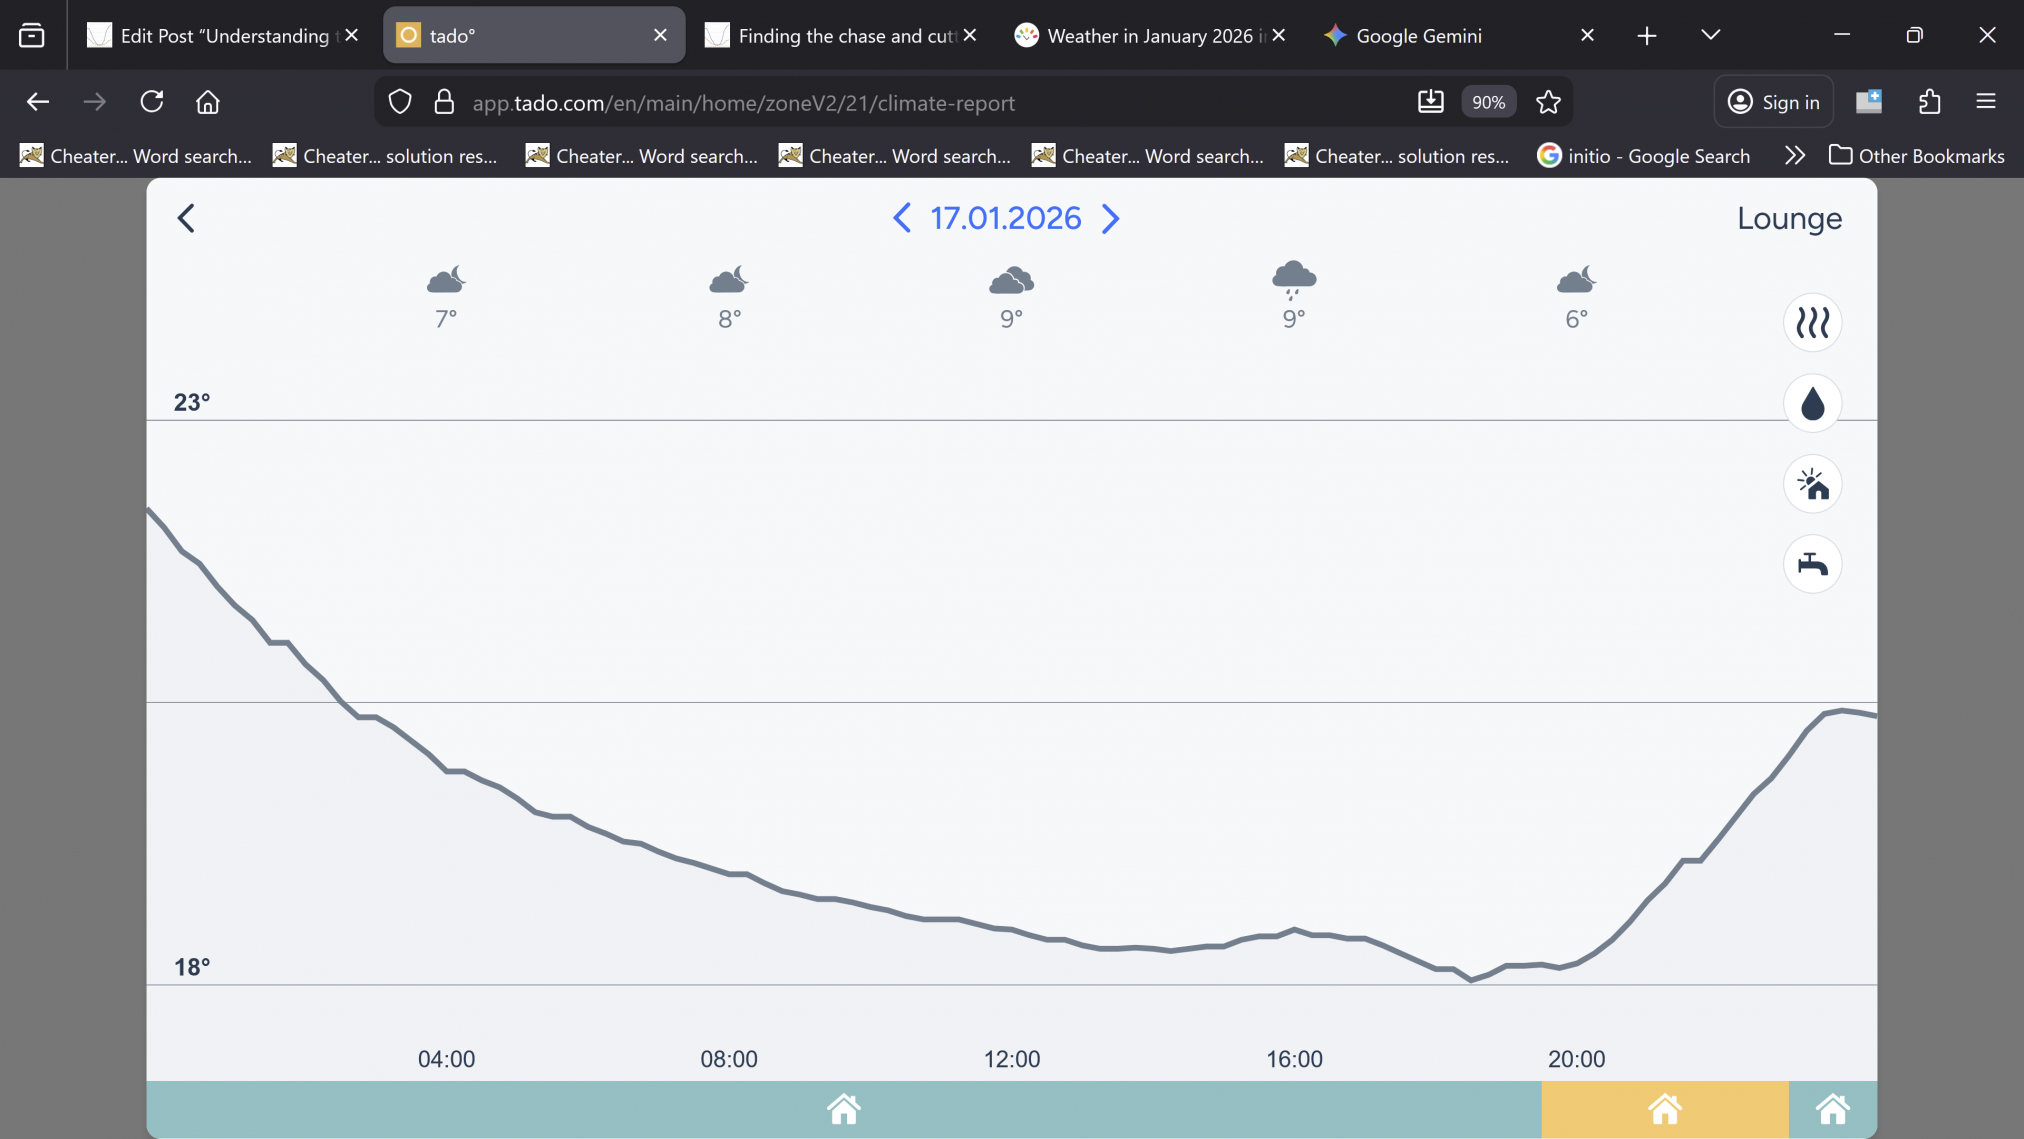
The day before, means the next day is the 17th January 2026. Let’s look at our tado app and read off what happened.
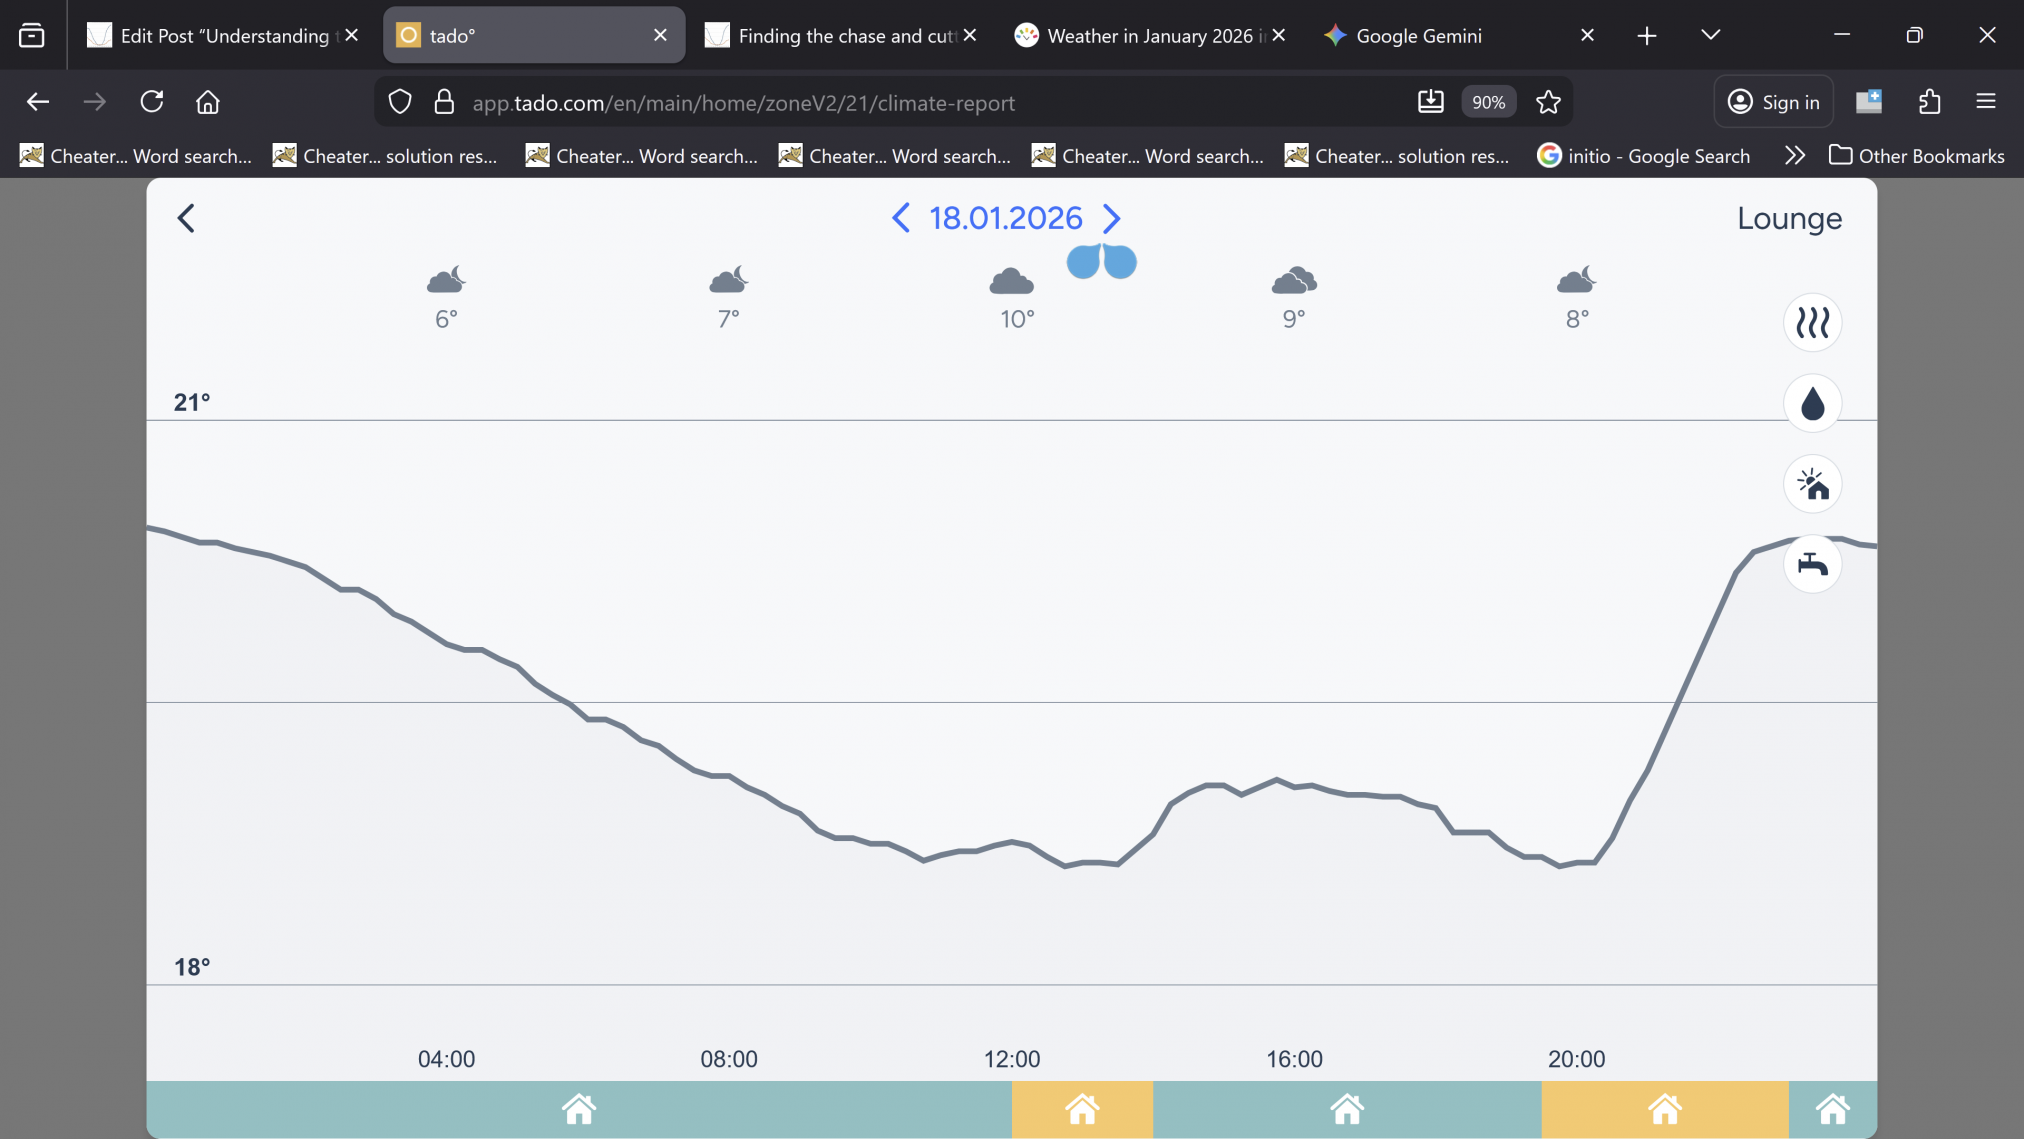
We close our curtains at nightfall, actually, I get the lights to come on 10 minutes before sunset which acts as a prompt to get up and draw the curtains. They are then opened about 7:45am the next morning.
We can see that overnight, the temperature drop is about the same but is much shallower until the curtains are opened, about 1°C. Now, we don’t have that much sun coming through the south window on the 17th January 2026, proven by the fact we only generated 1.9kWh from our solar panels that day!
In fact, the tado is passing that information on to use! See the clouds in the various time zones? We can see that we don’t have very much in terms of solar gain. But the biggest difference between the two days is the starting temperature when the heating kicks in.
Saturday 17th Jan, when the heating came on the temperature was 18.5°C.
Sunday 18th Jan, when the heating came on the temperature was 18.8°C.
0.3°C doesn’t sounds like much of a difference between the two shows, but it shows a big improvement in our u-values for the room, because of the save in terms of energy drop, or how much of the heat was conducted out of the room over the 12 hours in question, this is precisely what the effective u-value measures.
Curtains are not a simple addition, they need choosing, hanging, drawing, but it helps us calculate our u-value. We’re going to scrap some historical data first from https://www.timeanddate.com/weather/uk/ for our town and the 17th January. Between midnight and midday, the average temperature 6.9°C, given the room is 52m², we can see an obvious temperature drop of 4°C. So, we can assume our u-value for the entire room was 0.134 W/m²K.
Now, let’s look at the difference the curtains made: the estimated u-value was 0.121 W/m²K, we had only a 1.1°C drop but the outside temperature was an average of 6.5°C, so there’s actually more being done on that day.
The u-value is how much heat is transfered through an element of a building, or the heat conductivity and the lower the number the better. For both of these nights, the temperature outside was similar but the drop was dramatically different. In fact, on the day we had a smaller drop, the weather was cooler.
One addition has made a big difference to this room, thermally lined curtains. Nothing else is different.
I can quote you the fact the walls have a u-value of the walls is made up of the following layers:
Layer
Material
Typical Thickness
R-value
External Leaf
Standard Red Facing Brick
102.5 mm
0.17
Cavity/Insulation
Rockwool (Mineral Wool)
50 mm – 100 mm
2.7
Internal Leaf
White aircrete blocks
100 mm
1.1
Internal Finish
Plaster/Plasterboard (assumed)
13 mm
0.33
Total R-value = sum of the r-values for each layer = 4.3.
Wait a moment! What is an R-value?
We’re getting to that. An R-value is the “thickness” of a material. A thick winter coat is much warmer than a summer one for exactly that reason: it has a higher r-value because it is thicker and more insulating. We can also think of it as the opposite, or inverse, of the u-value, to such an extent that the:
u-value = => ≈ 0.23 W/m2K.
That’s all the walls in the lounge, as with If it’s all about the green part 1, we can then work out what that means in terms of electrical energy retained.
Now, we have our patio door, u-value = 1.2 W/m2K, and our triple glazed doors and windows, they are 1 W/m2K each, and we know our observed u-value comes to a total of 0.121 W/m2K for the entire room.
So, is that curtains for heat loss?
Doh! But they do seem to make a bit of a difference, don’t they?
Now, we’ve got some accidental things we seem to have done right. The curtains reach the floor and there isn’t much of a gap at the top. We could probably achieve more if they did reach the ceiling – there is less of a path allowing heat to escape.
They are thick, and therefore heavy, curtains, fully lined with an extra thermal layer. They are gathered, all helping to make them thicker and less conductive. They overlap themselves by 50mm and they go past the window edge, again less of a path for the heat to escape around.
Five years ago, I replaced many of our venetian blinds with roller blinds, and found similar impacts. We finished the last one of these in our bedroom, when we swapped out our smaller window for a set of French Doors. One thing I wasn’t expecting is the difference the balustrade made the French doors in terms of protection from the elements!
Out of interest, where did you come up with the u-value?
Ah. U=Q÷(A×t×ΔT).
Where Q = heat loss in terms of joules . A = area of the room = 110m2. t = time in seconds or 12 hours in this case, 43,200. ΔT = difference in temperatures or our temperature loss.
For the 17th January,
Q = Energy Lost=Thermal Mass×Temp Drop
Q = 2,196,850J/K×4.0°C= 8,787,400 Joules
ΔT = Starting temperature inside minus outside average temperature = 13.7°C.
So U = 8,787,400 / (110*43,200*13.7) = 0.134 W/m2K.
For the 18th January, Q = 8,128,345 and ΔT = 14.15°C
so, U= 8,128,345 / (110*43,200*14.5) = 0.121 W/m2K.
I haven’t really said where the Q (thermal mass) value is, I’ve just quoted it. This is made up of the surface materials in the room, our flooring, plaster, heating circuit… these all store heat and are entirely unique to your home. You can ask an AI like Gemini to help you work out what your values are likely to be or ask a heating engineer!