Do not accept a COP below 4.5 during the summer.
I promised results from April, so this is a little late. Here they are as a follow up to Going with the flow. We made a change to the temperature at which the electrical heater comes on for our heat pump. The question is: was that worthwhile?
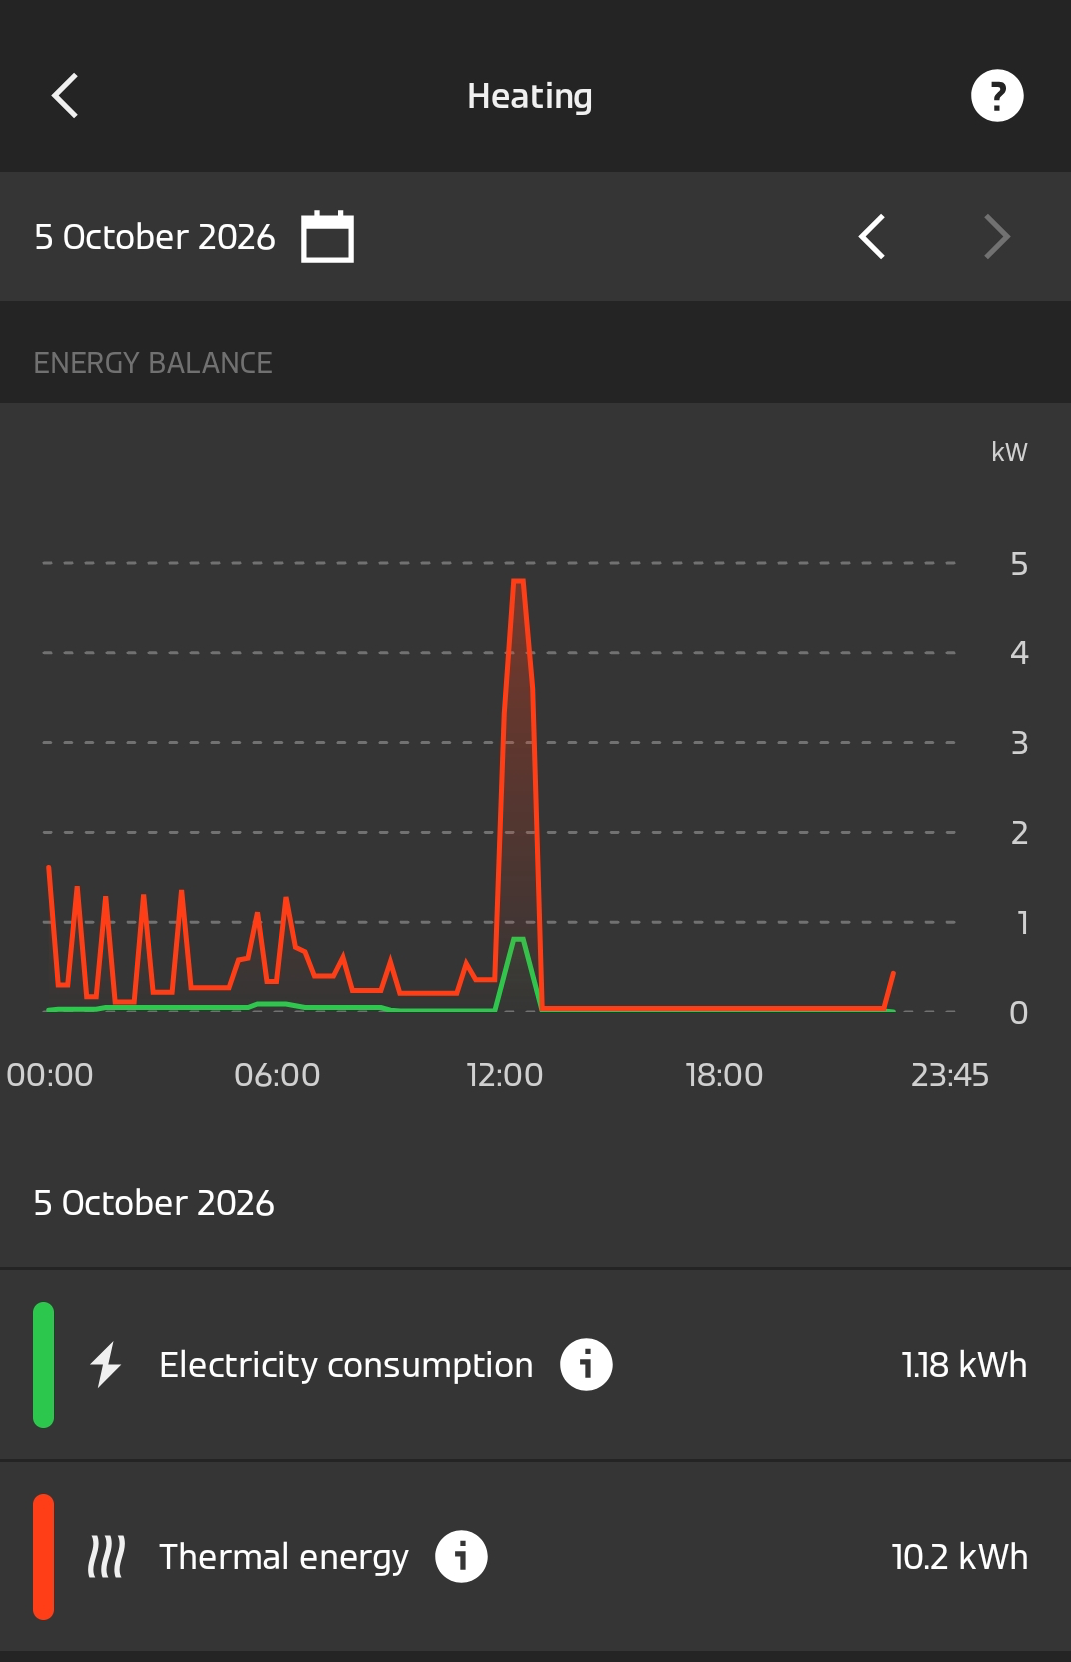
Our heat pump gives us the means to capture the information seen in the table below, as seen here. The Heat generated in kWh ÷ Total energy usage in kWh gives us the Coefficient of Performance (COP). Click on the image to see all the details.
If we compare that month by month, we can see how we doing in terms of energy used. During the summer, that energy comes from our solar panels, so is interesting but essentially free. During the winter, that might not be the case, so we need the COP to be as high as possible!
In fact, even the during the summer, making the most of our solar means we can do more with it or even sell it back to the grid as SEG. We need our heat pump to help us make the most of the energy available to be as sustainable as possible.
| Month | Total energy usage (kWh) | Compressor usage (kWh) | Heater usage (kWh) | Heat generated (kWh) | COP |
|---|---|---|---|---|---|
| January | 1,003.5 | 941 | 62.5 | 3,440 | 3.42 |
| February | 608.9 | 581 | 27.9 | 2,390 | 3.93 |
| March | 505.5 | 477 | 28.5 | 2,080 | 4.12 |
| April | 233.7 | 220 | 13.7 | 1,110 | 4.75 |
| May | 151.5 | 147 | 4.5 | 744 | 4.91 |
| June | 45.7 | 41.1 | 4.6 | 174 | 3.81 |
| July | 37.8 | 37.2 | 0.6 | 185 | 4.89 |
| August | 38.5 | 30.5 | 8.0 | 183 | 4.75 |
| September | 43.2 | 43.2 | 0 | 253 | 5.86 |
| October (so far) | 8 | 8 | 0 | 51 | 6.38 |
| November | |||||
| December | |||||
| Totals | 2,676.3 | 2,526 | 150.3 | 10,610 | 3.96 |
Last year, from Going with the flow, we can see the four months used 122.6kWh from the electrical heater. This hurts the performance of the heat pump as the electrical heater has a lower performance than the heat exchanger: only 1kWh of electricity generates 1kWh of heat. So, anytime that happens means our heat pump has performed worse! What was going on?
Apparently, I hadn’t switched off the electrical heater, I had just said “by preference, please use the compressor”. I only found this out once we’d had a service. Amazing what you learn from the people who really know their stuff!
I was shocked when checking the figures for August. Despite a really warm month, we had used 8kWh of energy by using the heater. How?
Deep in the settings, I found the kill switch and September, despite being cooler has been much more performant.
June is particularly poor!
Yes, it was. When you consider that January was colder than June by a whole 22°C, meaning in January you need to use more electricity in the heat exchanger, it’s a shame I hadn’t go the settings right for June.
Given that background, June’s COP being only a few points of a percent better than January means something was very wrong in the settings! If England expects every one to do their duty, I do not expect a COP below 4.5 during the height of summer!
Before the service in June (and I should have been paying attention), our COP was steadily climbing. A hot summer should mean we don’t need the heater at all. As it is likely to be a milder winter, it’s arguable whether we’ll need it this winter either.
So, I’m feel a bit disappointed I didn’t spot that setting much sooner after the service. Having had the kind of summer where we really did just turn off the heating in May, it would have been great to really enjoy the heat exchanger doing its stuff. While the heating was off, the DHW (direct hot water) is the primary focus of our heat pump. Making sure that is making the most of ambient heat during the hottest period of the year is what should be happening!
Something to use, then?
During the summer, yes, probably during the equinoxes too. But having that safety in play for the winter is important too. Along with “heat curves” which provide the programmes for the heat pump to use when the temperature drops.
During the spring, summer, and autumn, a heat curve of 0.7 provides staggered levels at which the heat flow temperatures are deployed. 0.7 says a cool temperature should be used in the heating circuit until the temperature gets to 0˚C.
By comparison a heating curve of 1.3 has that cut off happening much sooner and at a higher level. Perfect when it is consistently below -5˚C, but for a typical British winter, a curve of 1.0 is much more appropriate.
Meteorological winter begins on the 1st December. I plan to switch the heater capability back on then as it can lengthen the longevity of the heat pump’s compressor. So, that will be well worth doing!
Posted: October 10th, 2026 under Heat Pump.
Tags: Air source heat pump, Coefficient of performance (COP), energy efficiency, heat pump, Heating curves, Home energy, sustainable living
Comments: none