Working on basal rate 2
As I come to the end of my sabatical, I’ve had an infection that drove up my glucose rates and plumented them just as quickly at the end. The past three days have seen me hypo from 2am in the morning.
Which makes it a good time to review Basal Rate 2.
Hit me one more time, baby
😮 OK.
Excel is a brilliant tool for comparing two graphs and I use it for tracking my changes.
First I enter in my old basal rate as:
| Time | Old Basal rate 2 |
| 0 | 1.5 |
| 1 | 1.5 |
| 2 | 0.76 |
| 3 | 0.86 |
| 4 | 1.25 |
| 5 | 1.5 |
| 6 | 1.75 |
| 7 | 0.78 |
| 8 | 1.5 |
| 9 | 0.8 |
| 10 | 0.77 |
| 11 | 0.7 |
| 12 | 0.69 |
| 13 | 1.15 |
| 14 | 1.1 |
| 15 | 0.99 |
| 16 | 1 |
| 17 | 1 |
| 18 | 1.4 |
| 19 | 1.4 |
| 20 | 1.6 |
| 21 | 1.7 |
| 22 | 1.3 |
| 23 | 1.55 |
You will notice the time is actually the hourly rate in question: my pump allows me to have a different rate per hour which is great for tuning. But it is not a format accepted by the Basal Rate Estimator but we’ll come on to that in a moment.
I then take my interstitial glucose readings for the period I want to tune:
| Time | Old Basal rate 2 | Interstitial blood sugar |
| 0 | 1.5 | 4.5 |
| 1 | 1.5 | 4 |
| 2 | 0.76 | 3 |
| 3 | 0.86 | 3.2 |
| 4 | 1.25 | 2.2 |
| 5 | 1.5 | 2.2 |
| 6 | 1.75 | 2.2 |
| 7 | 0.78 | 2.2 |
| 8 | 1.5 | 2.1 |
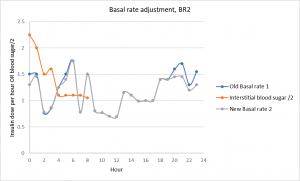
You can see here why I am tuning – I have a drop from 1am, my goal is to flatten out the curve :D.
Because the Basal Rate Estimator needs the information in a very specific format, I am going make some changes to the data. I don’t do this in Excel because that would be very hard to make useable for any period in question.
I’ve written a short script to do the job for me:
In powershell script…
Open excel spreadsheet
Open sheet
Work through the blood glucose (converting time to 12 hour clock and add :00 to each hour)
Work through the old basal rate (converting time to 12 hour clock and add :00 to each hour)
Work through the new basal rate (converting time to 12 hour clock and add :00 to each hour)
The output looks something like this:
Doing blood sugar
0:00 4.5
1:00 4
2:00 3
3:00 3.2
4:00 2.2
5:00 2.2
6:00 2.2
7:00 2.2
8:00 2.1
Doing old BR
0:00 1.5
1:00 1.5
2:00 0.76
3:00 0.86
4:00 1.25
5:00 1.5
6:00 1.75
7:00 0.78
8:00 1.5
…
10:00 1.3
11:00 1.55
Doing New BR
First guess is to use exactly the same values as the old basal rate as that will allow us to fine tune
We’re nearly there, I run the Basal Rate Estimator entering in the “BG” or my institial values: this is a simple cut and paste from the powershell output.
I use humalog, so I select that and enter in my insulin ratio (that needs to be the same units as my readings, as I work in mmol/l my value is 2.5).
Now, in this case, my first blood glucose reading is midnight and the last is 9am. I copy in my basal values between midnight and 9am but go to the bottom of the column and grab between 10pm and 11pm. If I don’t do that, the tool complains as it hasn’t got a starting value for insulin kinetics (how much insulin is in your system at midnight affecting your blood sugar).
Sounds fiddly!
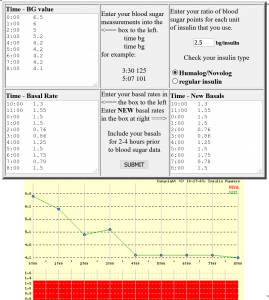
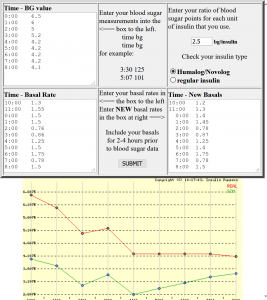
Bear with me. I’ve put in the input into the right boxes, in the right format, so let’s have a look at the output. First screen the graphs (real and simulated) overlay one another. We need to change the “new basal” to see a difference.
 So lets do that – I actually go through 4 iterations, but I’m guessing you’d like to see the final one.
 I can then copy that to my pump as day 2 of the basal run and back to the Excel Sheet, where I can then plot the graph.
Hang on a minute… the blood sugars look different
Ah, because I was hypo last night, the basal rate estimator tells me I’m hypo and refuses to work, so I add two to each value of the blood sugars to allow me to do the simulated run.
This all sounds like wet pieces of string and sticky tape…
I was doubtful the first time I used this methodology. The user interface is crude on the basal rate estimator however this is so much quicker than guessing which rate needs to be trimmed and by how much.
The 4am reading is still a dip. I’ve taken more than 1iu off my basal and that’s a huge change, so I will try that tonight and do a second estimation run tomorrow morning then move on to breakfast and lunch and tea. In five days, I normally get pretty close to having a flat line all day if I don’t eat which is a great place to be.
You talk about a script, can I have it?
Powershell scripts can be run on any Windows PC machine from Windows 7 onwards. I am very happy to share – here it is – but it’s very rough and ready at the moment.
Give me a couple of days to knock it into better shape and I will share on this page 🙂
Posted: December 6th, 2018 under 42, Diabetes.

